


MSU course admins and editors now have access to the Insights Portal for more advanced analytics reporting on courses in MSU D2L (Brightspace).
The Insights Portal now enables educators to use MSU D2L course statistics and visualizations to track, measure, and monitor student progress and help improve learner engagement aiding in student success.
Advanced features beyond the core course analytics in D2L include the Course Overview Widget, the Class Engagement Dashboard, and a variety of Portal Reports (hourly + daily). See below for some tips on using the D2L Insights Portal.
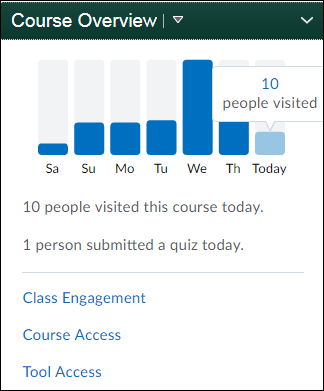
Course Overview Widget
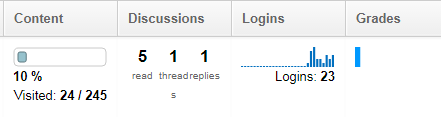
The Course Overview widget provides an at-a-glance visual of course access over the past week. Hovering over each bar in the graph indicates the number of people that have accessed the site each day. Links within the widget give quick access to other Insights reports on Class Engagement (also found on the Classlist page – more details below), Course Access, and Tool Access.
The widget is now available on the standard MSU Course Homepage. You may need to add the widget if you have a custom homepage.
Course Access Report
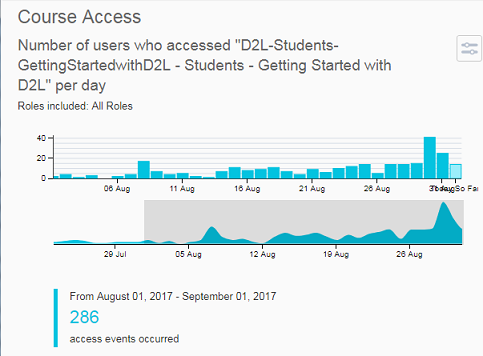
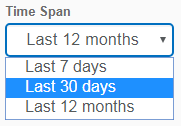
The Course Access report can be customized to select by roles and date range. Click and drag on the edge of the shaded rectangle (also referred to as a sparkline) to increase the date range for the report.
The number of course access events can be downloaded as an Excel or CSV spreadsheet for further data analysis and record keeping.
Tool Access Report
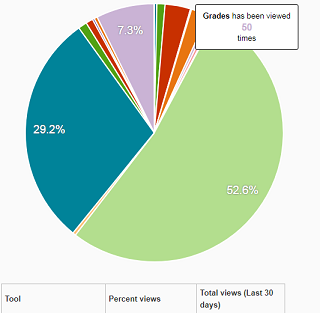 The Tool Access report gives a closer look at the tools being used for select date ranges. Hover over the pie chart or access the table underneath it for individual tool access events. This data can also be exported.
Class Engagement Dashboard
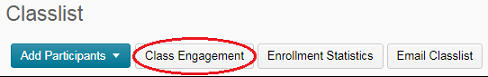
The Class Engagement Dashboard can be accessed via a link in the Course Overview widget, as well as from a button at the top of the course Classlist.
The Class Engagement Dashboard displays the number of students that have not accessed the course in the past seven days and an interactive bar graph of the current Grade Distribution that lets instructors filter a class list by grade ranges and then initiate interventions via email.
Click on grade ranges to filter students. Check the select all box, and click on “Email Selected” to send a bcc message to students fitting the criteria (selected grade range).
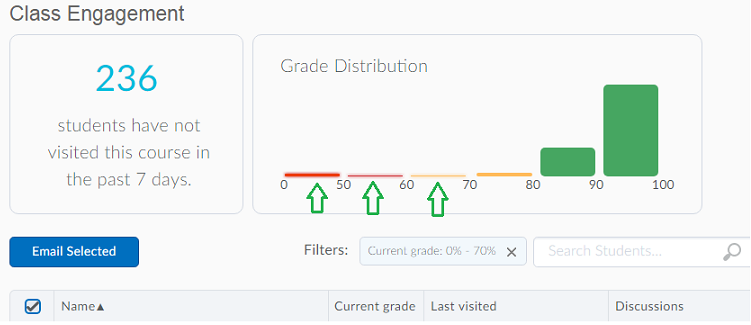
The dashboard also displays a sortable table of values including the Current grade, Last visited, and number of Discussion posts (as of July 24 when Insights was turn on in the system).
Clicking on values within the table will direct you to the student progress report. Keep in mind that the progress view is limited to the course end date. Insights reports are not limited by the course end date.
Portal Reports (hourly + daily)
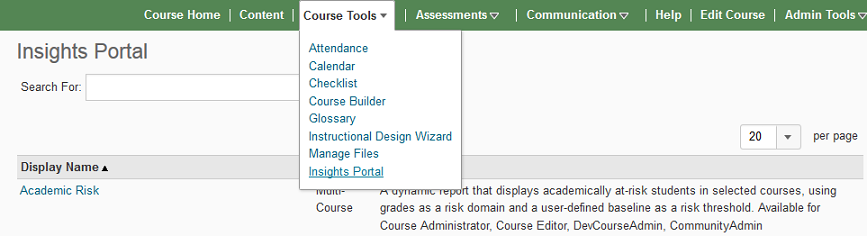
![]() The Insights Portal reports can be accessed from the Edit Course menu or from the Course Tools menu options in a standard navigation bar.
The Insights Portal reports can be accessed from the Edit Course menu or from the Course Tools menu options in a standard navigation bar.
There are a variety of reports to access with descriptions in the last column.
Running a report
To run an Insights report:
- Click on the title of the report.
- Click on “Select Values” for Roles (e.g., Select All, just Students).
- Enter other filter criteria such as thresholds (varies depending on the report).
- After making selections, click “Run Report.”
- Click on “Show Filters” to change criteria for another report.
- Reports can be exported as PDF, Excel, CSV, and XLSX files.
- When finished, click “Done.”
Examples shown below include Academic Risk, Course Access Details, Quiz Item Analysis, and Quiz Question Statistics.
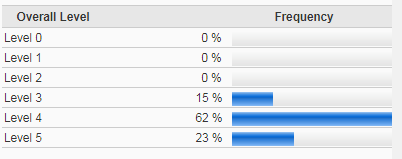
Academic Risk: Displays academically at-risk students filtered by the calculated grade with a selected risk threshold.

NOTE: Click the play icons wherever they occur to display charts.
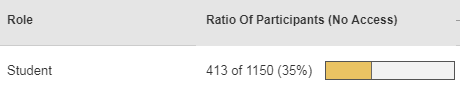
Course Access Details: Displays course access statistics for each user over a selected date range, as well as a horizontal bar graph indicating the percentage of students meeting the filter criteria, such as enrolled with no access.
The following shows a graph of a large enrollment course over the first two days of the semester, showing that 35% of the students had not accessed the class.
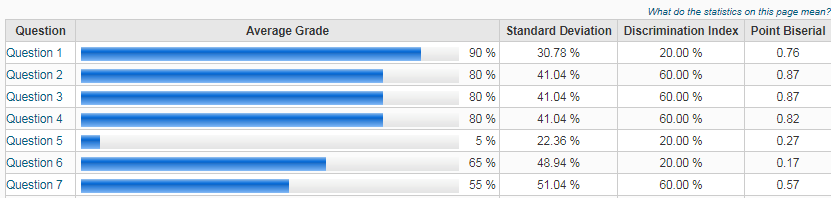
Quiz Item Analysis: This report is limited to quizzes with multiple choice questions that have only one correct answer each. The question order can be random, but all learners must receive the same set of questions. The report assesses results for the first quiz attempt only.
This report interprets the number of first attempts, total points, standard deviation, reliability coefficient, highest and lowest scores, upper quartile, lower quartile, and median and average scores. The table of values also includes the following data per question: Percent correct, discrimination index, point biserial, and response frequencies.
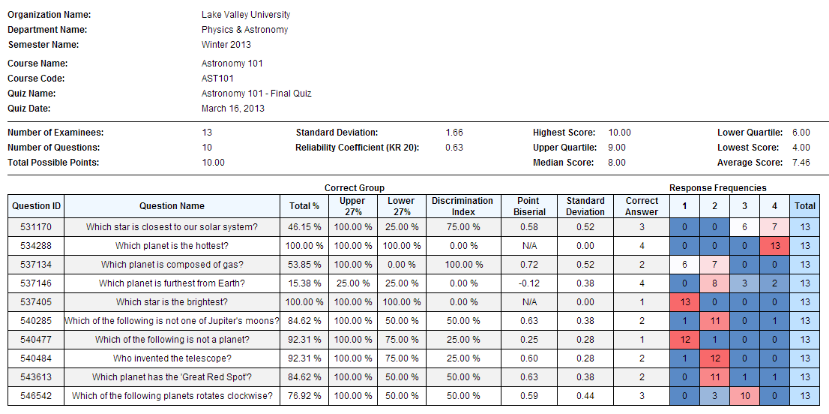
Read more on Interpreting the Quiz Item Analysis report.
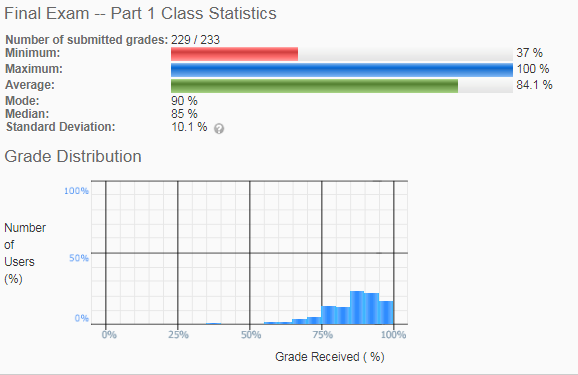
Quiz Question Statistics: The report has both a Summary view and a Detailed view. The Summary view shows course quiz question responses and final quiz score distributions. Comparing the grade of the quiz question to the student quiz grades lets the instructor understand the distribution of results and whether the question separates the top students from everyone else.
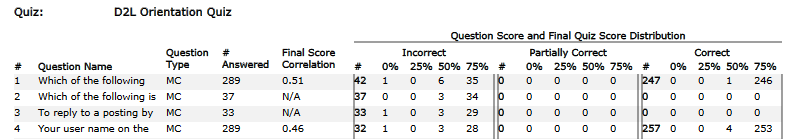
The Detailed view shows what other questions the student is likely to have answered incorrectly. The report displays the most problematic questions first.
Read more on Interpreting the Quiz Question Statistics report.
Core Analytics
If you are not already aware of the many pre-existing course and user statistics available to instructors, you may want to also explore the following areas available without Insights.
- Content > Table of Contents > Related Tools > View Reports – View the number of users visiting each content item with average time spent. Clicking on the numbers will display detailed content item statistics per user. The Users tab gives a clear picture of all content items accessed by an individual when you click on their name. The table shows number of visits, average time spent, and the last visit.
- Assessments > Class Progress – Displays an overview of items in a course. Go to the settings to replace an existing area with another choice. Clicking on a student’s name gives more details with summaries at the top and drill down reports. A new feature turned on with Insights, shows the Course Access history over the last 30 days.
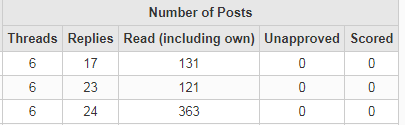
- Communication > Discussions > Statistics – Displays a table with number of Threads and Replies, as well as number of posts read by each user. The columns are sortable by clicking on the headings.
- Assessments > Quizzes > Statistics (see options across the top) – Summary shows quiz averages. Click on a quiz to see more details including User Stats, Question Stats, and Question Details. The Question Stats list the Standard Deviation, Discrimination Index, and Point Biserial for each question. You can click on the link above the table to learn more about what the statistics mean. For more, view the video on Generating Reports in D2L Learning Environment.
- Assessments > Grades > (Grade Item) Statistics – Use the pulldown menu by a grade item title and select Statistics to display Class and User Statistics.
- Assessments > Rubrics > (item) Statistics – Use the pulldown menu by a title and select Statistics. Select from tabs to view Overall, Criteria Statistics, and Individual Statistics.
Working with student data
Keep the MSU Institutional Data Policy in mind when storing data and making reports public in order to protect the security and confidentiality of student data. Read more about best practices for handling data.
More Resources
For further questions, contact the MSU IT Service Desk at (517) 432-6200 or ithelp@msu.edu.